

CAD $3,652.74
Starting monthly sales
December 2023A Canadian seller's monthly Amazon sales grew nearly fourteenfold over 25 months. Here is the real month-by-month trend and the account work carried out along the way.
Increase in monthly ordered product sales
December 2023 to January 2026 · CAD
Starting monthly sales
December 2023Monthly sales at the milestone
January 2026Growth period
26 complete monthly recordsMonthly sales were relatively low and uneven. When our team reviewed the account in early 2024, product pages needed attention, some listings had restrictions or missing information, and advertising campaigns lacked a clear structure. There was an opportunity to improve everyday account operations before scaling sales.
Growth was not the result of a single adjustment. Our team focused on practical changes across the Amazon account.
Reviewed titles, product information, images and search terms to improve listing quality and visibility.
Assessed campaign structure and targeting to support more focused advertising decisions.
Followed up on inactive or restricted listings, catalog problems and Seller Central support cases.
Supported FBA inventory planning and monitored sales and account performance as the catalog developed.
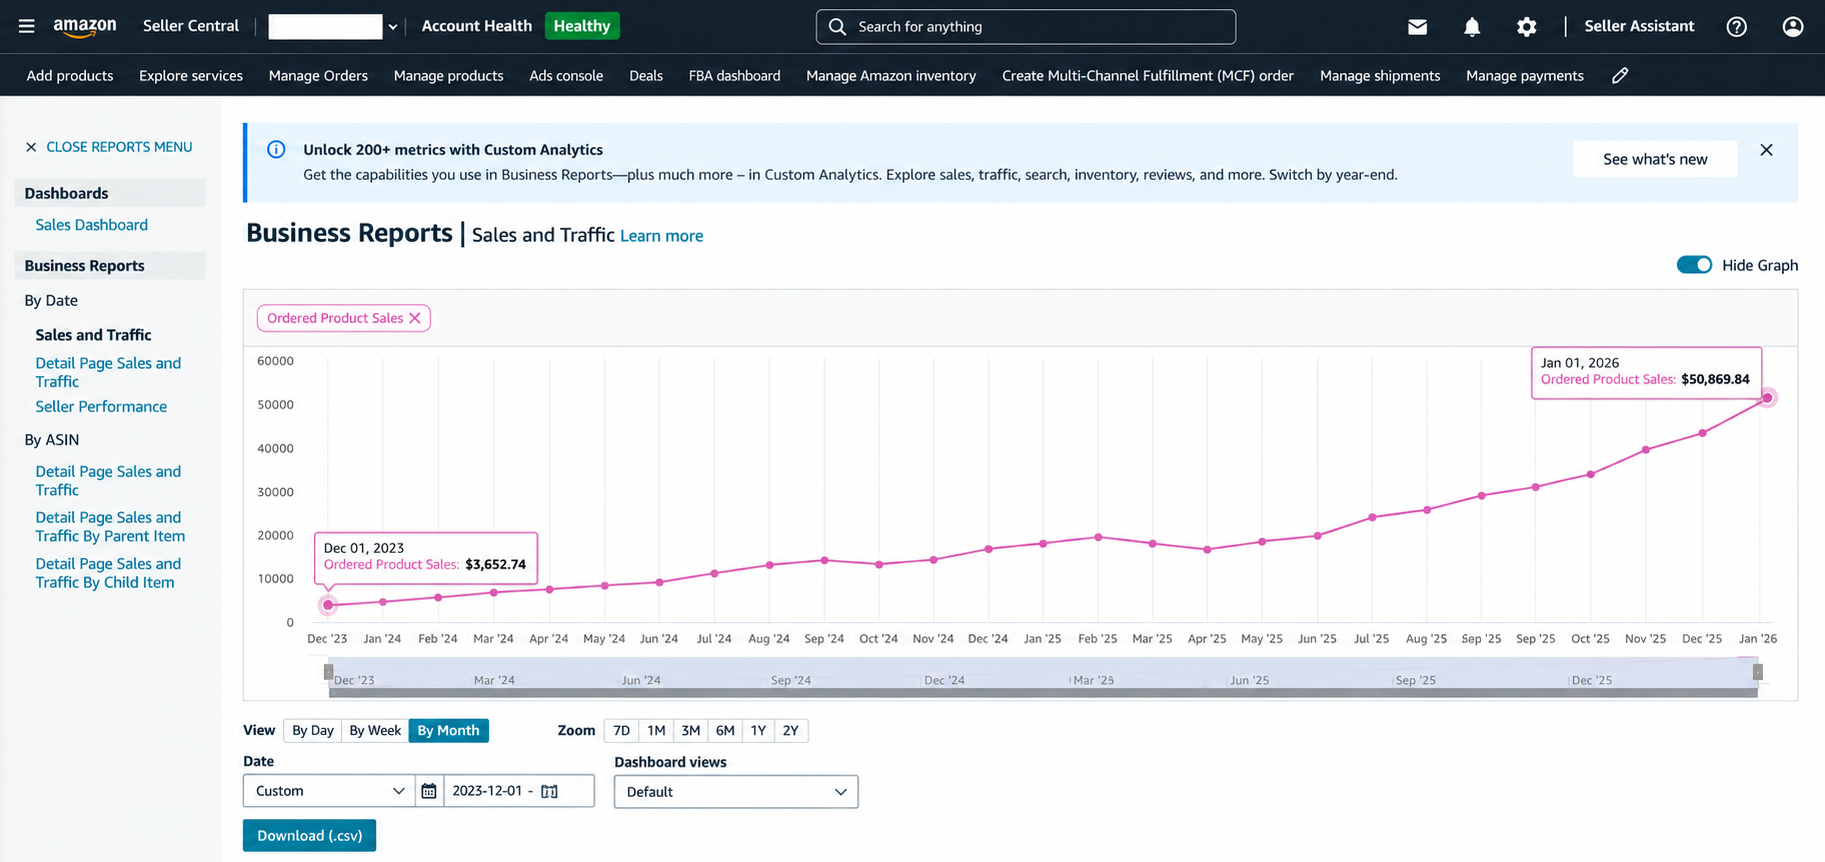
Monthly ordered product sales on Amazon.ca, from December 2023 to January 2026. The trend includes every month, including periods when sales declined before rising again.
December 2023 – January 2026 · CAD
Monthly sales (CAD)
By January 2026, monthly ordered product sales reached CAD $50,869.84, compared with CAD $3,652.74 in December 2023. That is a measured increase of 1,292.6%. The path was not a straight line: sales rose, softened in some months and continued to develop over more than two years.
The chart uses recorded monthly ordered product sales from Amazon Canada seller reports. It does not use advertising-attributed revenue, payouts, profit or forecast values. December 2023 was before our account work began in February 2024. Performance can also be affected by demand, pricing, assortment, competition and seasonality; the chart does not claim that one service alone caused all growth.
| Month | Monthly sales (CAD) |
|---|---|
| December 2023 | CAD $3,652.74 |
| January 2024 | CAD $4,261.53 |
| February 2024 | CAD $6,431.84 |
| March 2024 | CAD $9,374.97 |
| April 2024 | CAD $10,961.50 |
| May 2024 | CAD $8,055.66 |
| June 2024 | CAD $11,959.54 |
| July 2024 | CAD $13,967.66 |
| August 2024 | CAD $12,832.01 |
| September 2024 | CAD $13,855.46 |
| October 2024 | CAD $17,184.35 |
| November 2024 | CAD $20,539.44 |
| December 2024 | CAD $21,504.24 |
| January 2025 | CAD $31,493.82 |
| February 2025 | CAD $24,910.28 |
| March 2025 | CAD $23,450.03 |
| April 2025 | CAD $21,894.54 |
| May 2025 | CAD $22,687.55 |
| June 2025 | CAD $20,528.34 |
| July 2025 | CAD $21,848.76 |
| August 2025 | CAD $22,958.56 |
| September 2025 | CAD $24,267.00 |
| October 2025 | CAD $31,207.99 |
| November 2025 | CAD $42,854.51 |
| December 2025 | CAD $40,448.41 |
| January 2026 | CAD $50,869.84 |
We manage listings, advertising, Seller Central issues and inventory coordination as part of day-to-day Amazon operations.
Book a strategy call